Using Filebeat to Ship Tomcat Logs to Elasticsearch
Apache Tomcat is an open-source web application server that gives developers the ability to deploy enterprise Java-based web apps. Widely used and well documented, it is often the go-to choice for organizations in a multitude of domains.
With Tomcat playing such a critical role in the deployment process, it should be no secret that the teams maintaining their applications need visibility into Tomcat logs. Such logs can provide a wealth of information on crashes, hangs, resource consumption, access attempts, and much more, allowing teams to troubleshoot and respond to incidents.
However, logs in their raw form as files can only go so far in garnering an understanding of the overall deployment. For example, if you wanted to enumerate all the IP addresses that send requests to your server, doing so using a log file would be a cumbersome process. In cases where infrastructure teams maintain multiple servers, the issue is only compounded. It would therefore help to have a tool that allows you to not just aggregate, but also visualize, search and analyze your logs. This is where Elasticsearch and Kibana come in.
Elasticsearch is a distributed, RESTful search and analytics engine capable of addressing a growing number of use cases. It centrally stores your data for lightning fast search, fine‑tuned relevancy, and powerful analytics that scale with ease [1]. Kibana is a free and open user interface that lets you visualize your Elasticsearch data and navigate the Elastic Stack [2].
In other words, if you were to ship your Tomcat logs to Elasticsearch, you could leverage the analytics capabilities of Elasticsearch and visualize it all with Kibana. This can give you unprecedented insight into your deployments, helping your support team easily access the metrics that matter without having to go over lines and lines of log files. An example of a Kibana dashboard is given below.
In this blog post, I will be going over how to ship logs from your Tomcat deployments to your Elasticsearch endpoint. Filebeat is a lightweight agent that we will be using to collect, parse and ship logs.
Part 1: Housekeeping
Environment Details:
OS: Ubuntu 20.04.1 LTS
Application: Apache Tomcat 9
Filebeat: 7.9.3
This article assumes that you have Tomcat, Filebeat, Elasticsearch and Kibana set up. If not, you may refer to the following links for instructions:
- Installing Tomcat on a Ubuntu server
- Installing Filebeat on a Ubuntu server [Follow step 1 only]
- Installing Elasticsearch
- Installing Kibana
Once Tomcat and Filebeat have been set up, you can move on to Part 2 where we will use Filebeat to collect, parse and ship Tomcat Logs to an Elasticsearch endpoint.
Part 2: Setting up Filebeat to ship Tomcat Logs
Before we get to the actual configuration, I wanted to quickly go over the solution design.
By default, Tomcat 9 stores its logs in /var/log/tomcat9/ under three distinct log file types:
- catalina.<Date>.log
- localhost.<Date>.log
- localhost_access_log.<Date>.txt
For access logs, we will be using the Filebeat Apache module. This essentially provides us with a “plug-and-play” that requires minimal manual configuration.
For catalina and localhost logs, we will be writing our own parsers using a powerful Filebeat construct known as tokenizers.
Once the logs have been parsed, we will be shipping them to their respective ES indices. A flow-diagram of the design is given below.

To configure filebeat, navigate to /etc/filebeat/ on your server and rename filebeat.yml to filebeat.yml.defaults using the following command: sudo mv filebeat.yml filebeat.yml.defaults
This will allow us to quickly access the default configuration should things go wrong in the future. Then create a new filebeat.yml file with the following contents:
Save and close filebeat.yml
Next, type the following command into the terminal to enable the Filebeat Apache module:
sudo filebeat modules enable apacheOpen up /etc/filebeat/modules.d/apache.yml and use the following configuration:
Save and close apache.yml
Fire up Filebeat:
sudo systemctl start filebeatYou can check if Filebeat is up and running by using the following command:
sudo systemctl status filebeatGo to your Kibana console, and set up the tomcat9-* index template. For instructions on setting up an index template, follow these instructions.
Restart Tomcat:
sudo systemctl restart tomcat9Head on to the Discover page in Kibana. You should soon see events coming in under the tomcat9-* indices.
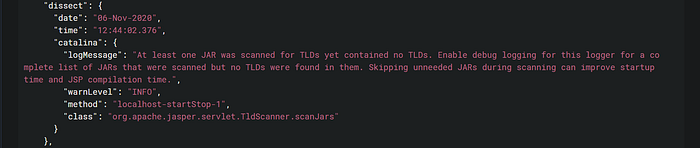
To confirm that the parsing worked, open up any event under tomcat9-catalina-logs-<YYYY.MM.DD> and there should be a “dissect” JSON object in the event body. Figure 3 shows an example of one such object where the Catalina logs have been split into fields like logMessage and warnLevel.
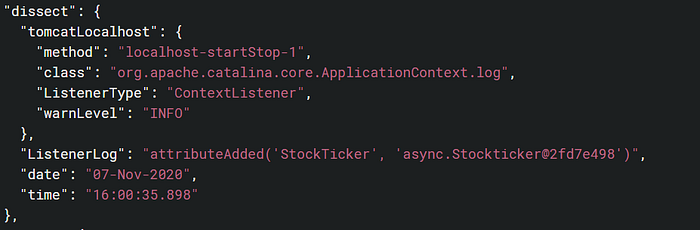
Similarly for localhost logs, the parser generated relevant key-value pairs under the “dissect” object.
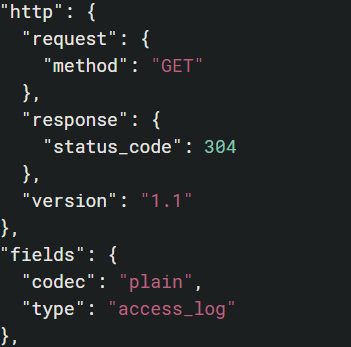
And lastly, we can confirm that the Apache module is correctly parsing the access logs by looking at any event under tomcat9-access-logs-<YYYY.MM.DD>.
Figure 5 shows a snippet from one such event with the request method and response status code reflected in their own JSON objects.
Conclusion
We have seen how to use Filebeat to collect, parse and ship Tomcat logs directly to Elasticsearch. By using a combination of modules and tokenizers, you can eliminate the need for maintaining resource (and subsequently capital) intensive processors such as Logstash.
The visualization capabilities of the ELK stack allow you to gain actionable insights into your Tomcat servers, that you can then use to streamline operations, enhance incident response, and efficiently allocate resources.
Further Reading
Filebeat documentation
Creating a dashboard in Kibana
— Arsh